Data Processing - clean your data, classify open-ended questions and get instant and actionable dataset
Tidy up your data. Our dedicated team follows the best practices of data processing to ensure that it is ready for tabulation and analysis.
At TGM, data processing helps "clean" the research data after the data collection by checking the quality and consistency of the responses.
We work with:




OUR DATA PROCESSING
Data quality is our main priority. We do not only apply the screen control system, but we also conduct a review of the responses to ensure high quality for the research results and guarantee its validity.
DATA TABULATION
Quantitative data is subject to basic processing, which includes the creation of tables when it is needed, the weighting of data or the displaying of the research results in subgroups. Then, if the study design specifies it, we can do further data analysis based on different methods such as MaxDiff Analysis, Kruskal Analysis and Segmentation.
Our team is known for its ability to take the most difficult data tabulation specifications and turn around clean, mistake-free tables.
Our team is known for its ability to take the most difficult data tabulation specifications and turn around clean, mistake-free tables.
DATA CLEANING
Before you analyze your survey results, data cleaning is a must-do. It helps you get the best quality data so you can make more accurate decisions.
The collection of data and acquisition of clean and actionable data that is of good quality and properly formatted is an essential process at TGM before proceeding with the actual data analysis. We know that improper data processing can lead to many errors during analysis.
The collection of data and acquisition of clean and actionable data that is of good quality and properly formatted is an essential process at TGM before proceeding with the actual data analysis. We know that improper data processing can lead to many errors during analysis.
SENTIMENT CODING
In terms of qualitative and verbatim research data, there will be quite a bit of manual work and data processing the creation of a classification and coding system to group ideas by topic. Once the data is analyzed and integrated into reports, we will use it to make further analysis of results, strategic conclusions and recommendations.
We develop data collected in qualitative researches as part of expert reports, which include the sentiment of statements on specific topics. We can also use the AI Enhanced automated coding or manual qualitative input coding at the request of the customer. Additionally, we can provide transcripts of qualitative research (FGIs and IDIs) online with their translations in different languages in a written form as well as in video recordings.
We develop data collected in qualitative researches as part of expert reports, which include the sentiment of statements on specific topics. We can also use the AI Enhanced automated coding or manual qualitative input coding at the request of the customer. Additionally, we can provide transcripts of qualitative research (FGIs and IDIs) online with their translations in different languages in a written form as well as in video recordings.
COMBINING SOURCES TO DEEPEN INSIGHT
We can analyze both of the data that we possess and the data that we receive from the client, such as sales data, CRM systems data, data collected from social listening of channels in social media and other sources of communication with clients and stakeholders.
CUSTOMIZED ONLINE DASHBOARD
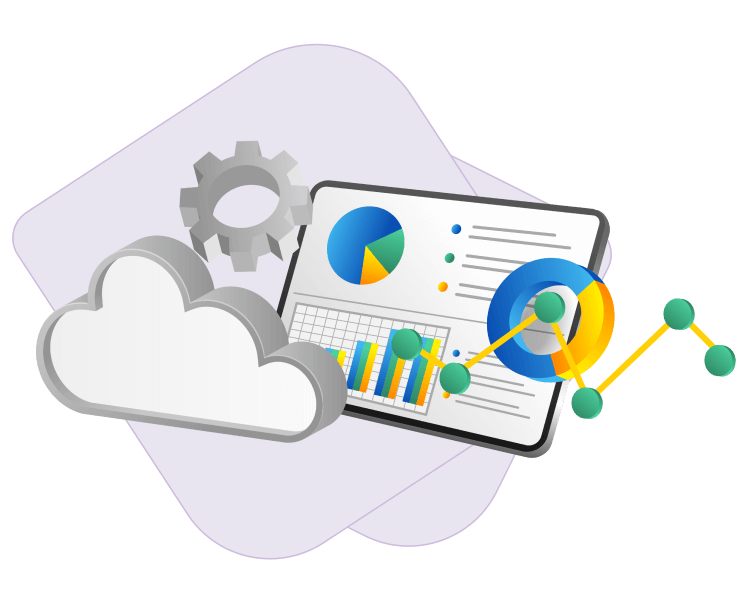
The next step of the data processing includes creating a customized online dashboard for you. On the Power BI Dashboard, we can define KPIs and smartly use advanced analytics and provide the different teams in your company with indicators that are important to them in the tracking research.
The processed data will be available live, 24/7, for those with access to the different parts (defined by you) of the dashboard. The Online Dashboard is a tool for presenting data that is easy to use and does not require any particular software for it. Filter the research results as you like and enjoy smooth data processing made by you with only one click.
The processed data will be available live, 24/7, for those with access to the different parts (defined by you) of the dashboard. The Online Dashboard is a tool for presenting data that is easy to use and does not require any particular software for it. Filter the research results as you like and enjoy smooth data processing made by you with only one click.
Need high quality analytics?
From real-time field reports and verbatim responses to more advanced analysis.
Our Panels
Reach global, think local – with our proprietary research panels.
TGM Research panels in Europe
 Albania
 Austria
 Azerbaijan
 Bosnia And Herzegovina
 Bulgaria
 Czech Republic
 Estonia
 Finland
 Georgia
 Greece
 Hungary
 Iceland
 Ireland
 Kazakhstan
 Latvia
 Lithuania
 Moldova
 Montenegro
 North Macedonia
 Norway
 Romania
 Slovakia
 Slovenia
 Sweden
 Ukraine
 United Kingdom
Read more about our panels and data sampling methods.
TGM Research panels in Africa
 Botswana
 Ethiopia
 Mozambique
 Namibia
 Rwanda
 Tanzania
 Uganda
 Zambia
Read more about our panels and data sampling methods.
TGM Research panels in Asia Pacific
 Bangladesh
 Brunei
 Cambodia
 China
China
 Hong Kong
 Laos
Laos
 Malaysia
 Mongolia
 Myanmar
 Nepal
Nepal
 New Zealand
 Singapore
 Sri Lanka
 Taiwan
 Turkmenistan
 Uzbekistan
Read more about our panels and data sampling methods.
TGM Research panels in The Americas
 Bolivia
 Chile
Chile
 Dominican Republic
 El Salvador
 Guatemala
 Honduras
 Nicaragua
 Panama
 Paraguay
 Puerto Rico
Read more about our panels and data sampling methods.
Join the world’s best-known brands that work with us.
We have a proven track record of assisting some of the world’s leading multinational companies and organizations, both in the private and public sector.

Why work with us?

TEAM OF EXPERTS
Our dedicated research team of consultants will guide you through all steps of your market research. They will provide full consultancy and understanding of the local specificities and ensure that the same methodology will apply. For the sampling plan, we aim to provide the exact same blend and sources for respondents across countries and waves so you can have comparable data for repeated measurement and historical trends. Our consultants will also support you with analytics to generate automated charting, create dashboards and turn data into insights. We will adapt the research and representation of the results to your needs and the needs of your organization after you let us know who will receive the research results, how will the results be used, and what are the main goals of the business.

PROACTIVE
When working on research, our agency can be a catalyst that helps employees who have been immersed in the project for a long time gain a fresh perspective and lead them to new ideas. We have experience in business consulting and creating marketing strategies, sales strategies and strategies for specific brands and products. We use this experience in conducting workshops for customers, both before the study - to define research goals, key process assumptions, developing the study and the sample, collecting the data, and after the presentation of the study results - to popularize them in the organization and facilitate their processing and implementation of the recommendations resulting from the study. If you decide to cooperate with us, you will not be alone at any stage of the research - we will do it with you.
SPEED, SPEED, SPEED
Market research with TGM is not just a product; it is a game-changing solution that allows you to access one integrated global audience for your data collection, reaching almost any profile of people, anywhere, at any time. A research solution that uses technology on a deep level to provide fast results with automated dashboards and customized reporting ready to use. Our consultants, located in different time zones, will coordinate all aspects of your project with agility, using decades of experience to provide a fast turnaround. Thanks to the distribution of our team in different parts of the world, your project will be dealt with 24 hours a day. We have a long experience working remotely, so we can communicate and work effectively to complete your project faster than you think.
PROJECT MANAGEMENT
Market research can be an iterative process. To ensure the greatest level of comfort for our customers, during the study, we take on the organizational burden, both in terms of coordinating subsequent stages of the study and coordinating work in several markets at once (if necessary).

COMPREHENSIVE APPROACH
We use a variety of qualitative and quantitative research tools for new ideas, processes, services, and products, thanks to which we learn about the opinion of customers regarding a tested concept on a deep level. Depending on your needs, we will propose the most effective research tools and methods as well as methods of processing marketing research.
COST EFFICIENCY
Working with us will lower your market research costs and increase your profitability through economies of scale. TGM Research has its own proprietary audience of respondents worldwide, and our unique digital technology for research combined with automation reduces local project management for your project. Your perfectly optimized content goes here!
Get better responses. Faster
With TGM, you have more than 120 markets and multiple local teams helping to execute your global project


